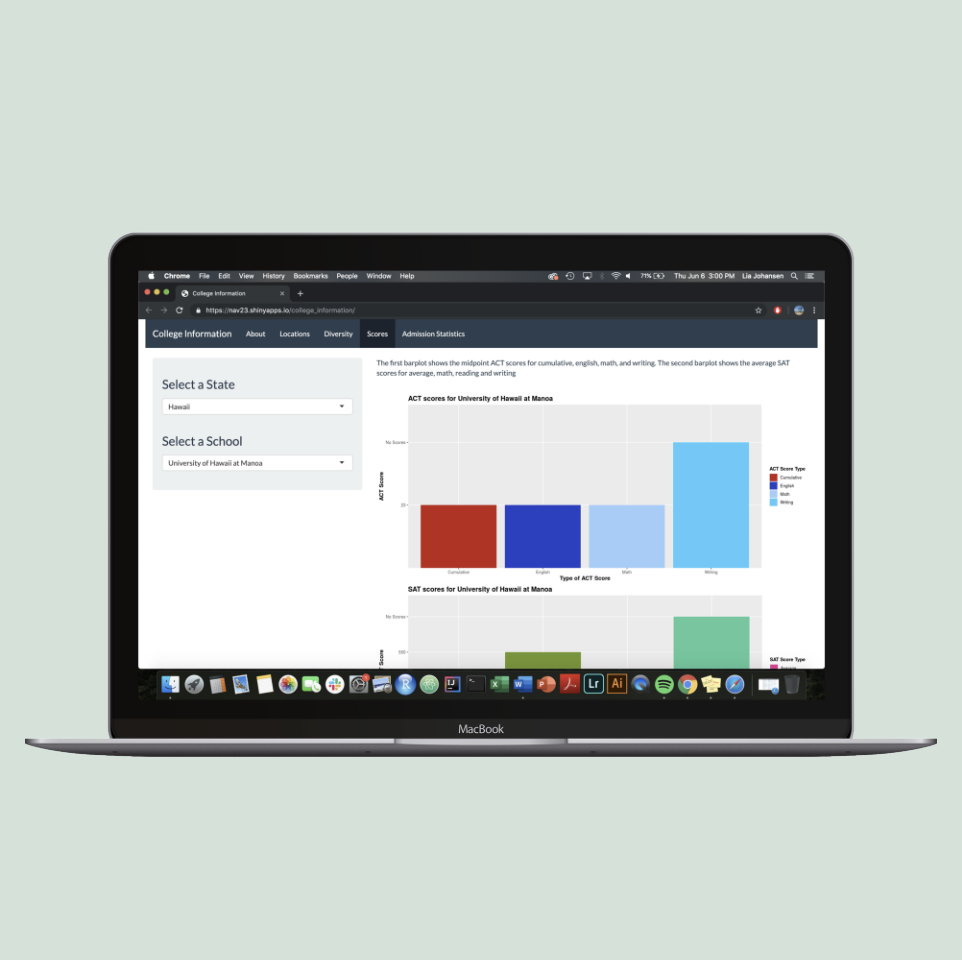
SHINY APPLICATION
INTERACTIVE COLLEGE STATISTICS
INTERACTIVE COLLEGE STATISTICS
Context: Final project for INFO 201 (Technical Foundations in Informatics)
Duration: 2 weeks (Fall 2018)
Collaboration: Member of a 4-person team
Tools: Programming language R, Github, Slack
This was our final project in my INFO 201 class where I combined all of the skills I learned throughout the course, stretched my skills by diving into an interesting dataset, and developed an interactive web application.
DATASET
My team and I were all sophomores so the college admissions process was still fresh in our minds. We knew we wanted to make an interactive application that would help graduating high school students choose a college. The primary audiences were high school and college transfer students intending to apply to college, and the secondary audience was the applicants' parents.
The dataset was sourced from the U.S Department of Education. It is from the most recent 20 years and includes admission rates, tuition rates, SAT/ACT scores, etc. Click here to view the data. We captured the data using R by reading the downloaded CSV file. We narrowed down our dataset based on key information students typically want to know about colleges such as location, costs, diversity, test socres, and admission statistics.

We started with this CSV file that included all
of the data we planned to transform into visuals
CODING
Due to previous coding collaboration experience, I recognized the importance of a shared game plan. I convened my teammates and created a project plan that delegated the project tasks and set deadlines to keep the project on track. We coded our project in R and collaborated using Git.
This project exercised my prior knowledge of Git that I had gained from being the lead software developer on my high school's robotics team. This enabled me to help my teammates code collaboratively and solve merge conflicts using Git. My team and I quickly learned how to clearly communicate our intentions and actions to avoid merge issues. We used Slack to communicate in between in-person meetings.
I was responsible for coding the graphs that depicted the scores. I used R packages such as DPLYR, ggplot2, and plotly for data wrangling and creating interactive visualizations. I used the Shiny R package to create the interactive web application.
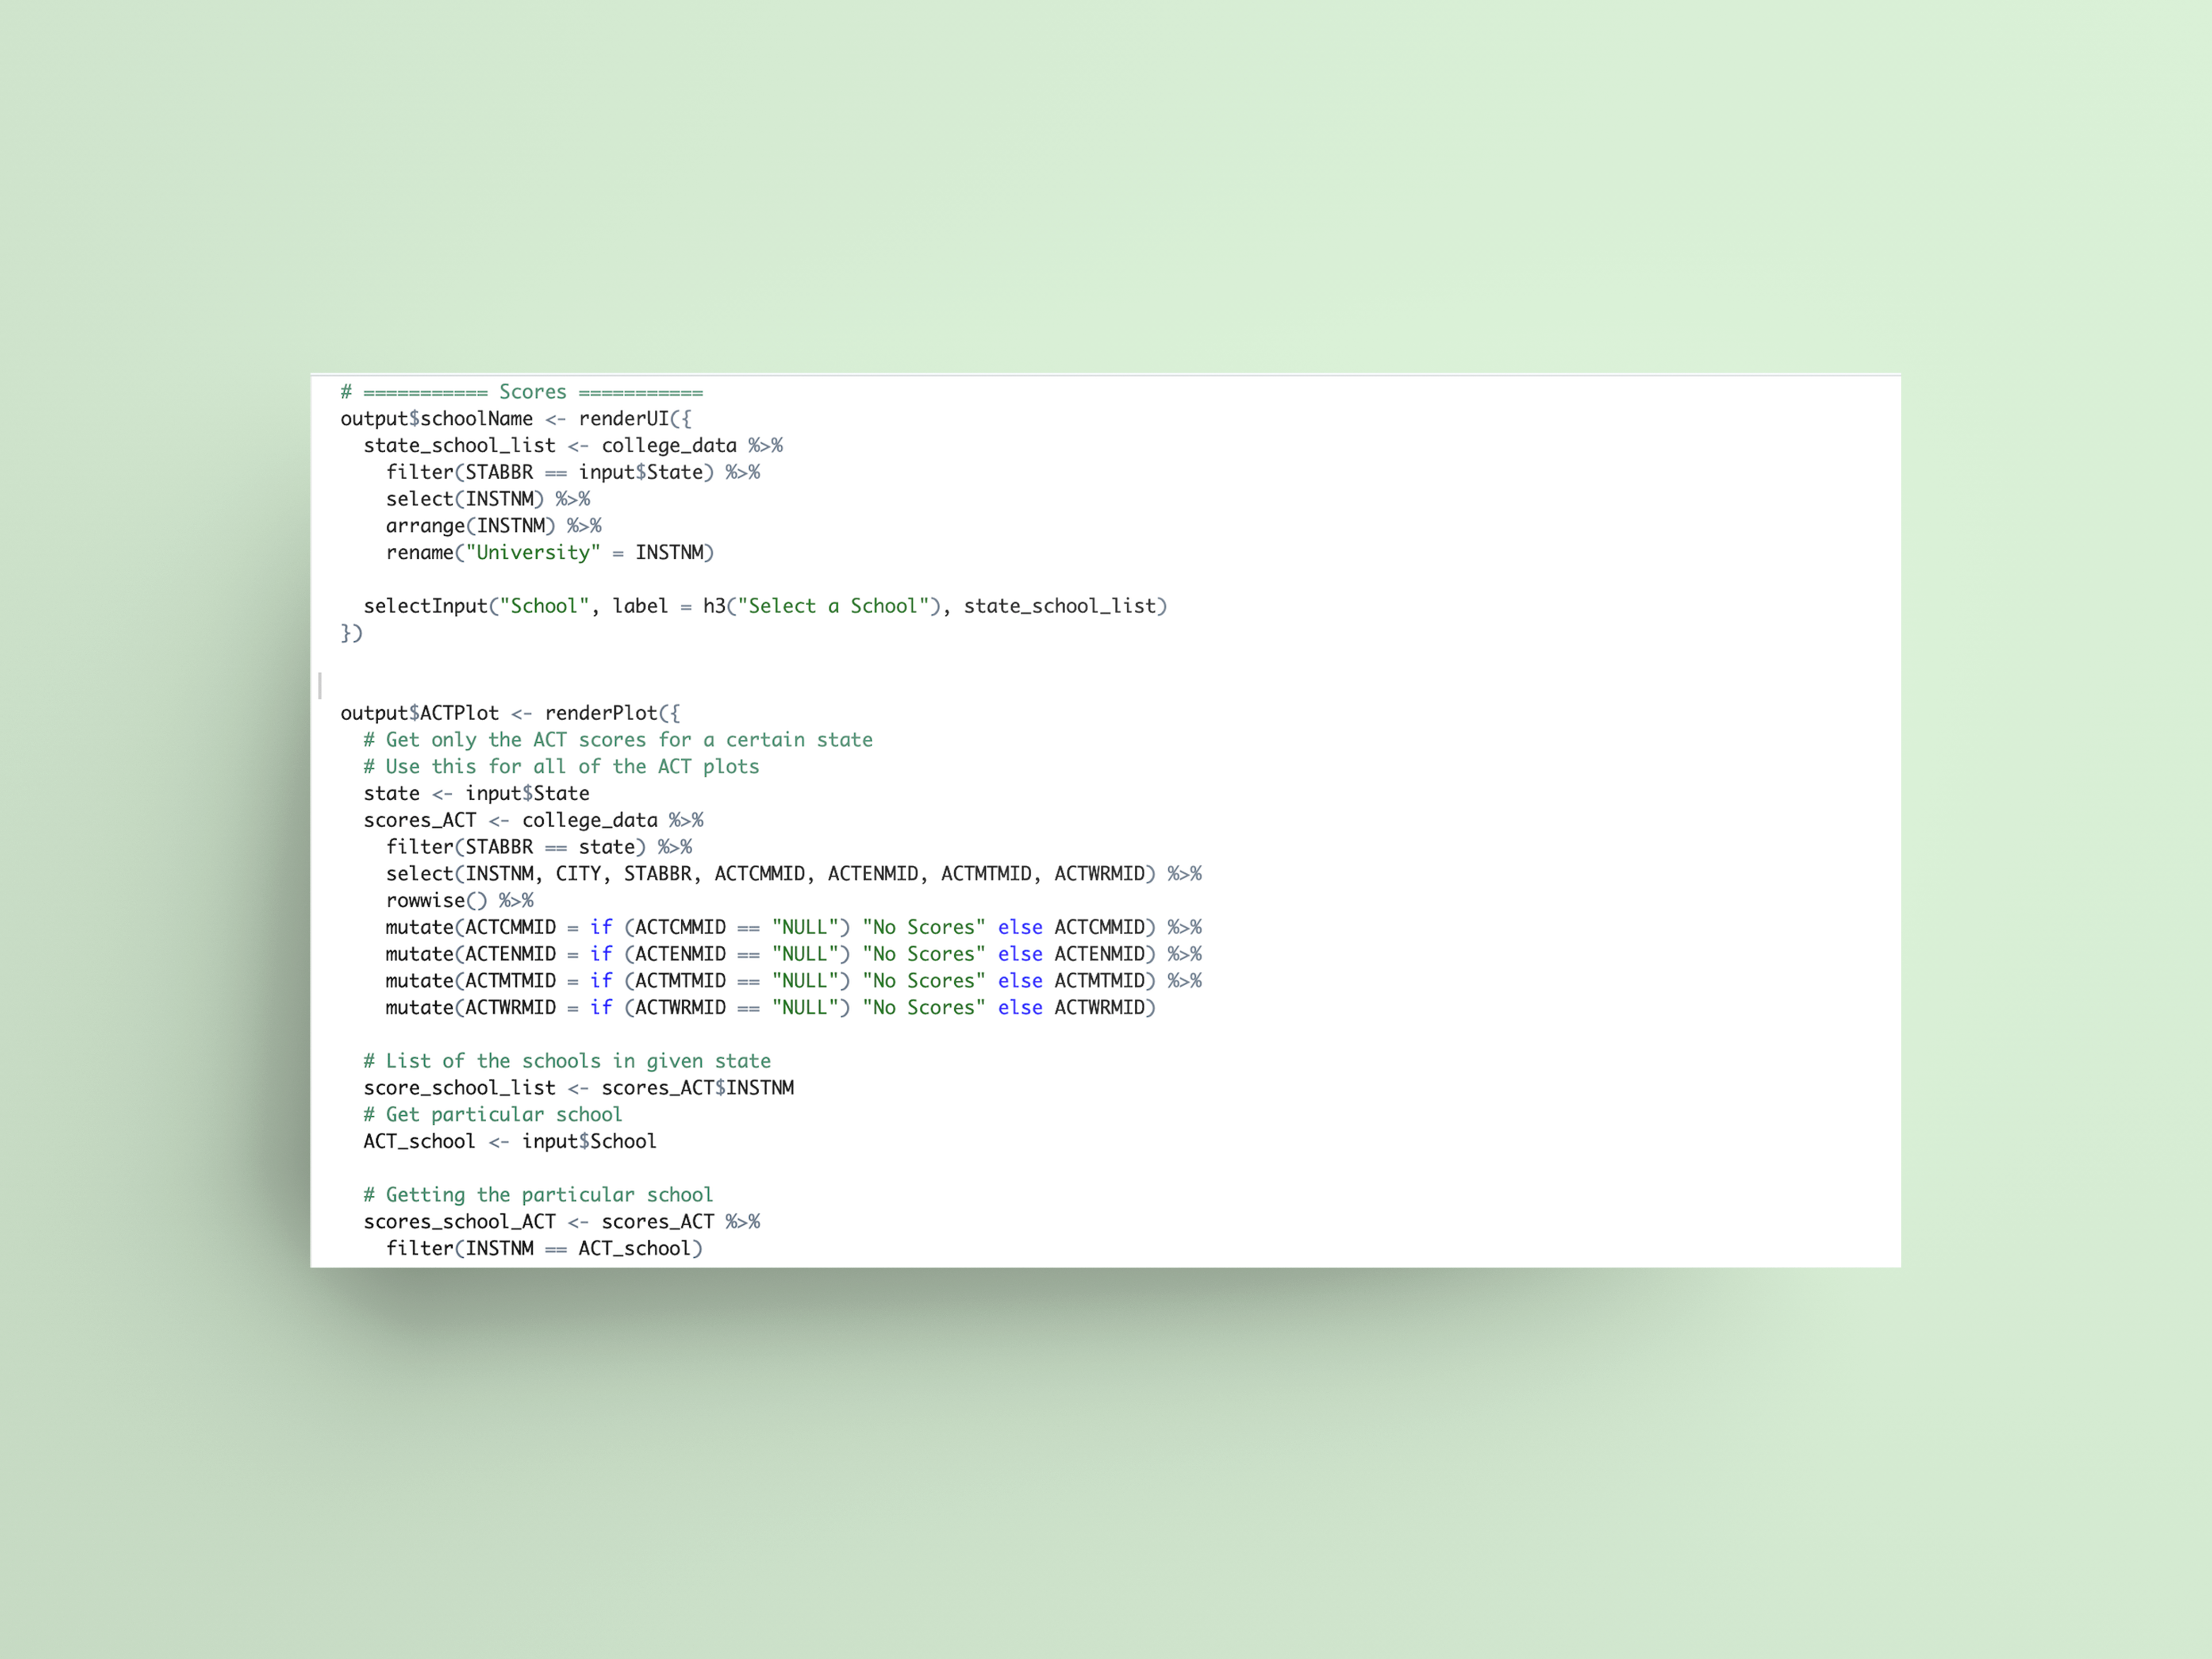
See R code here
After surveying a few recent high school graduates, I confirmed that students are especially curious about ACT/SAT admission scores when applying to colleges. I created bar charts that visually compared the relevant math, writing, and reading scores for selected schools.
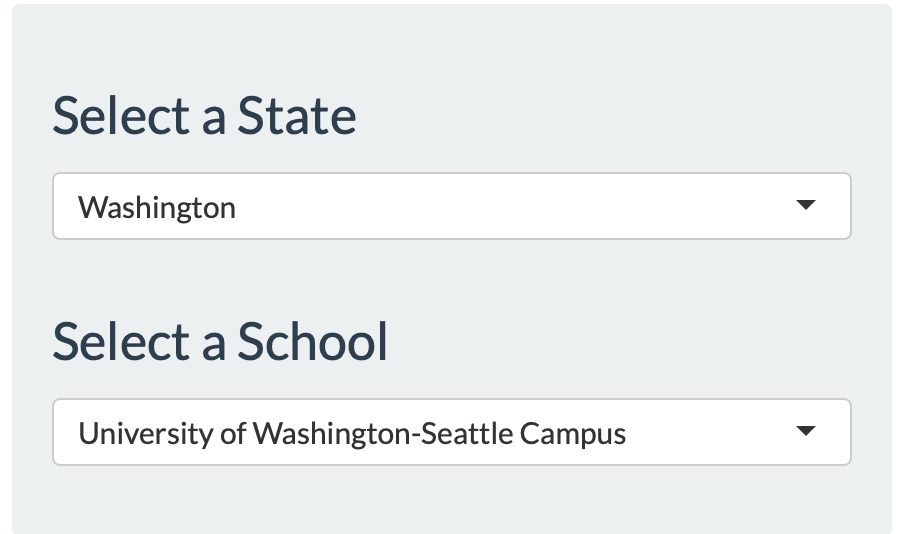

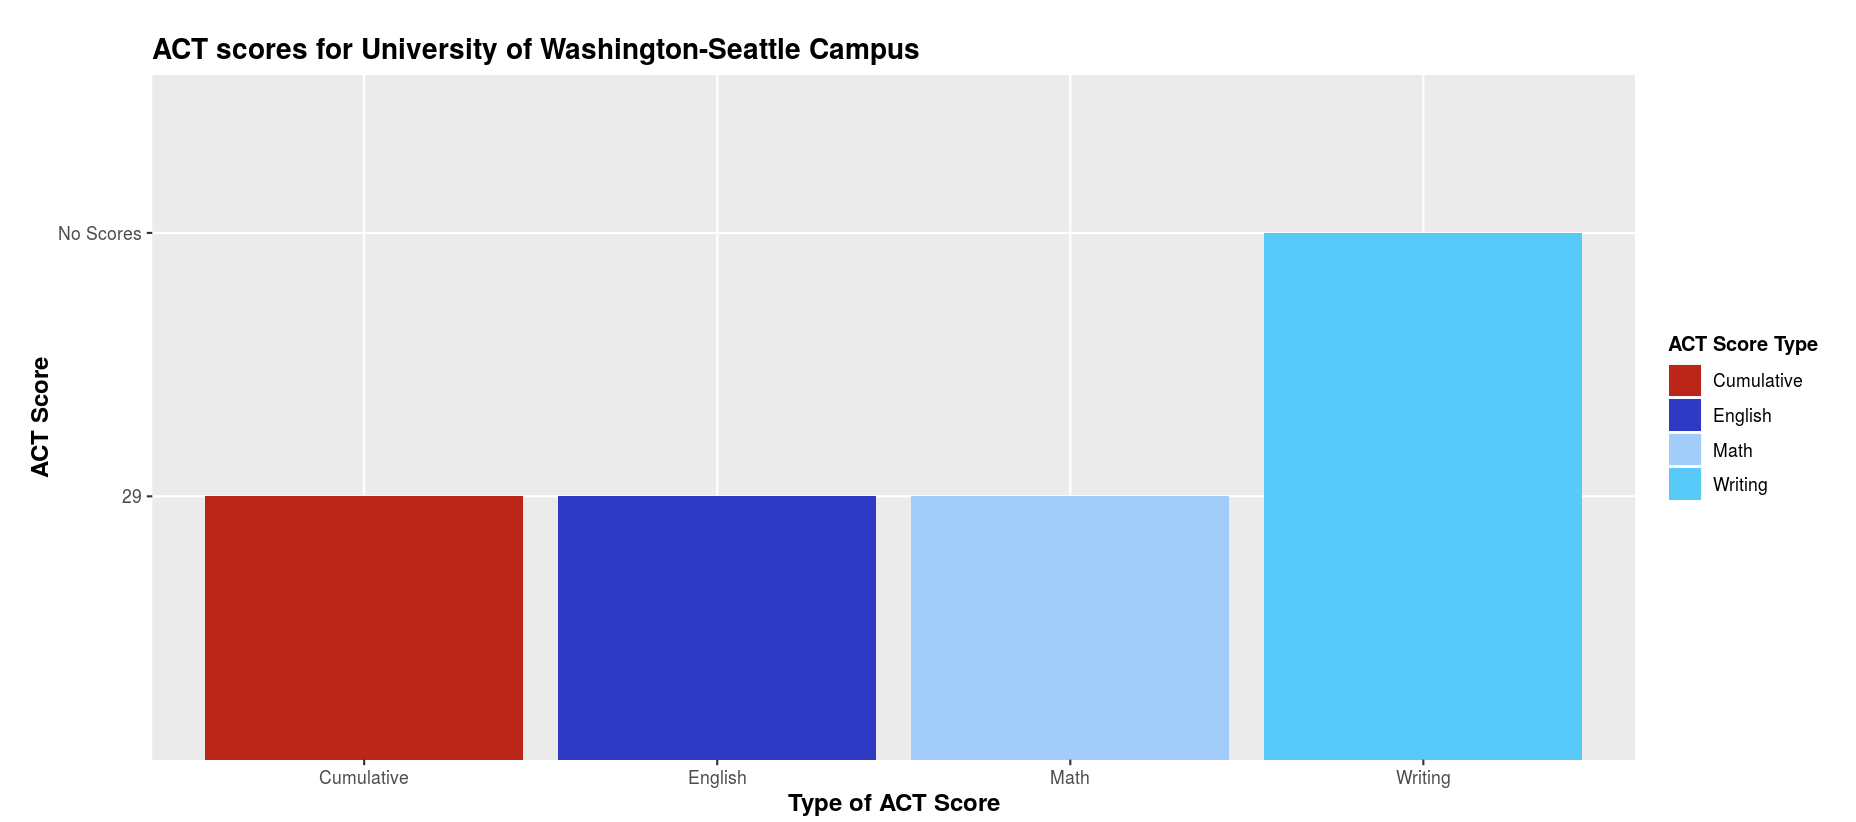
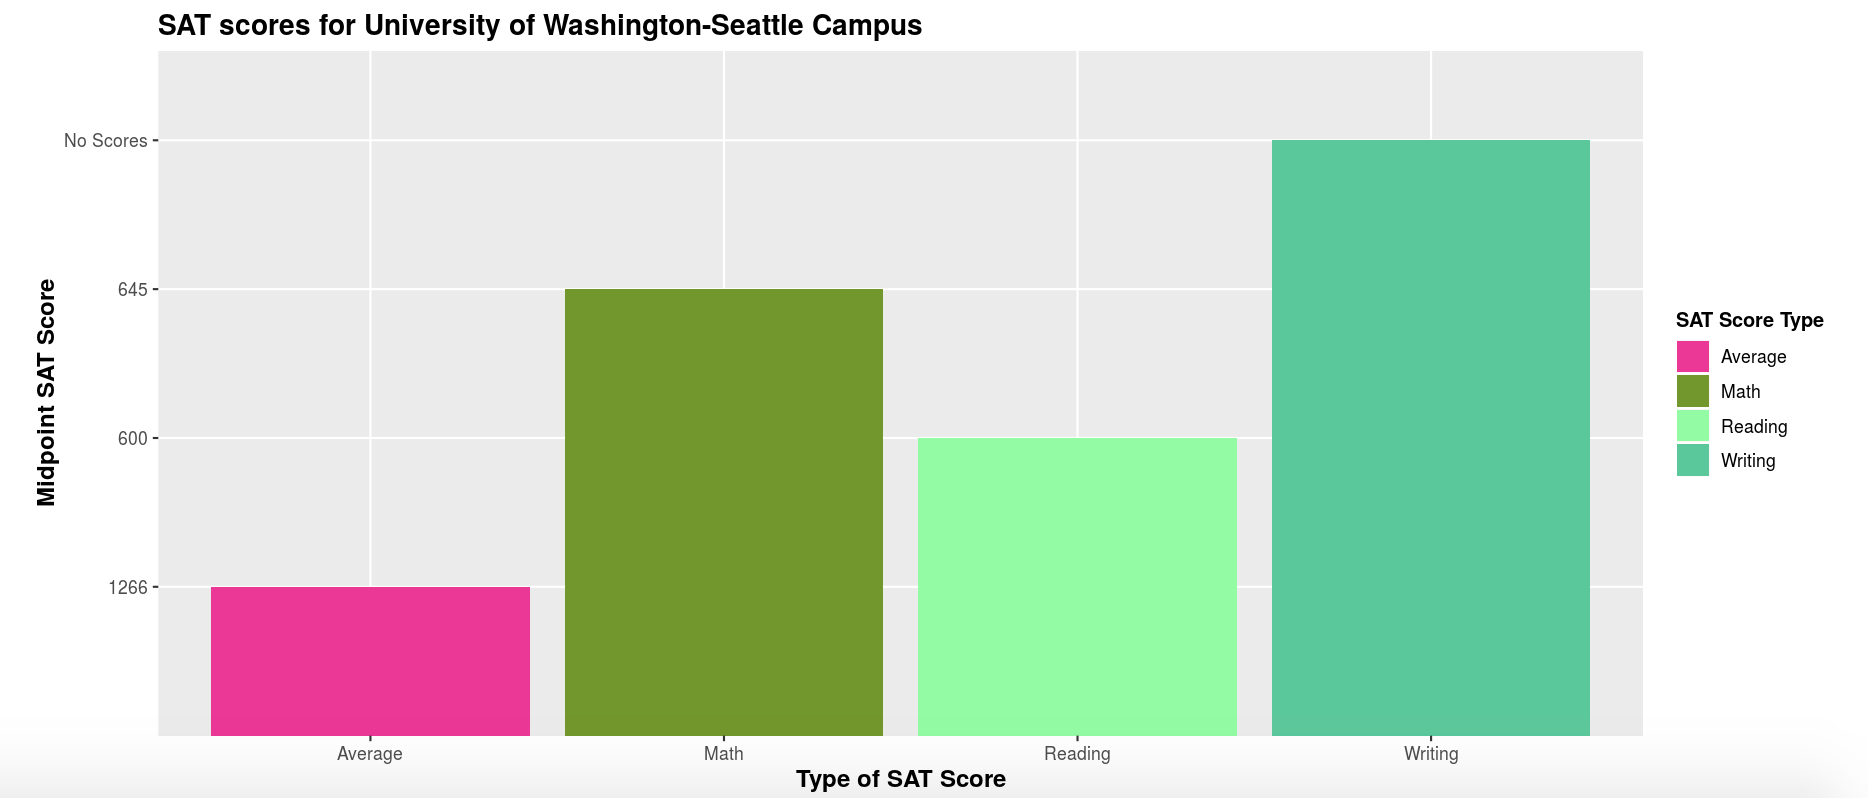
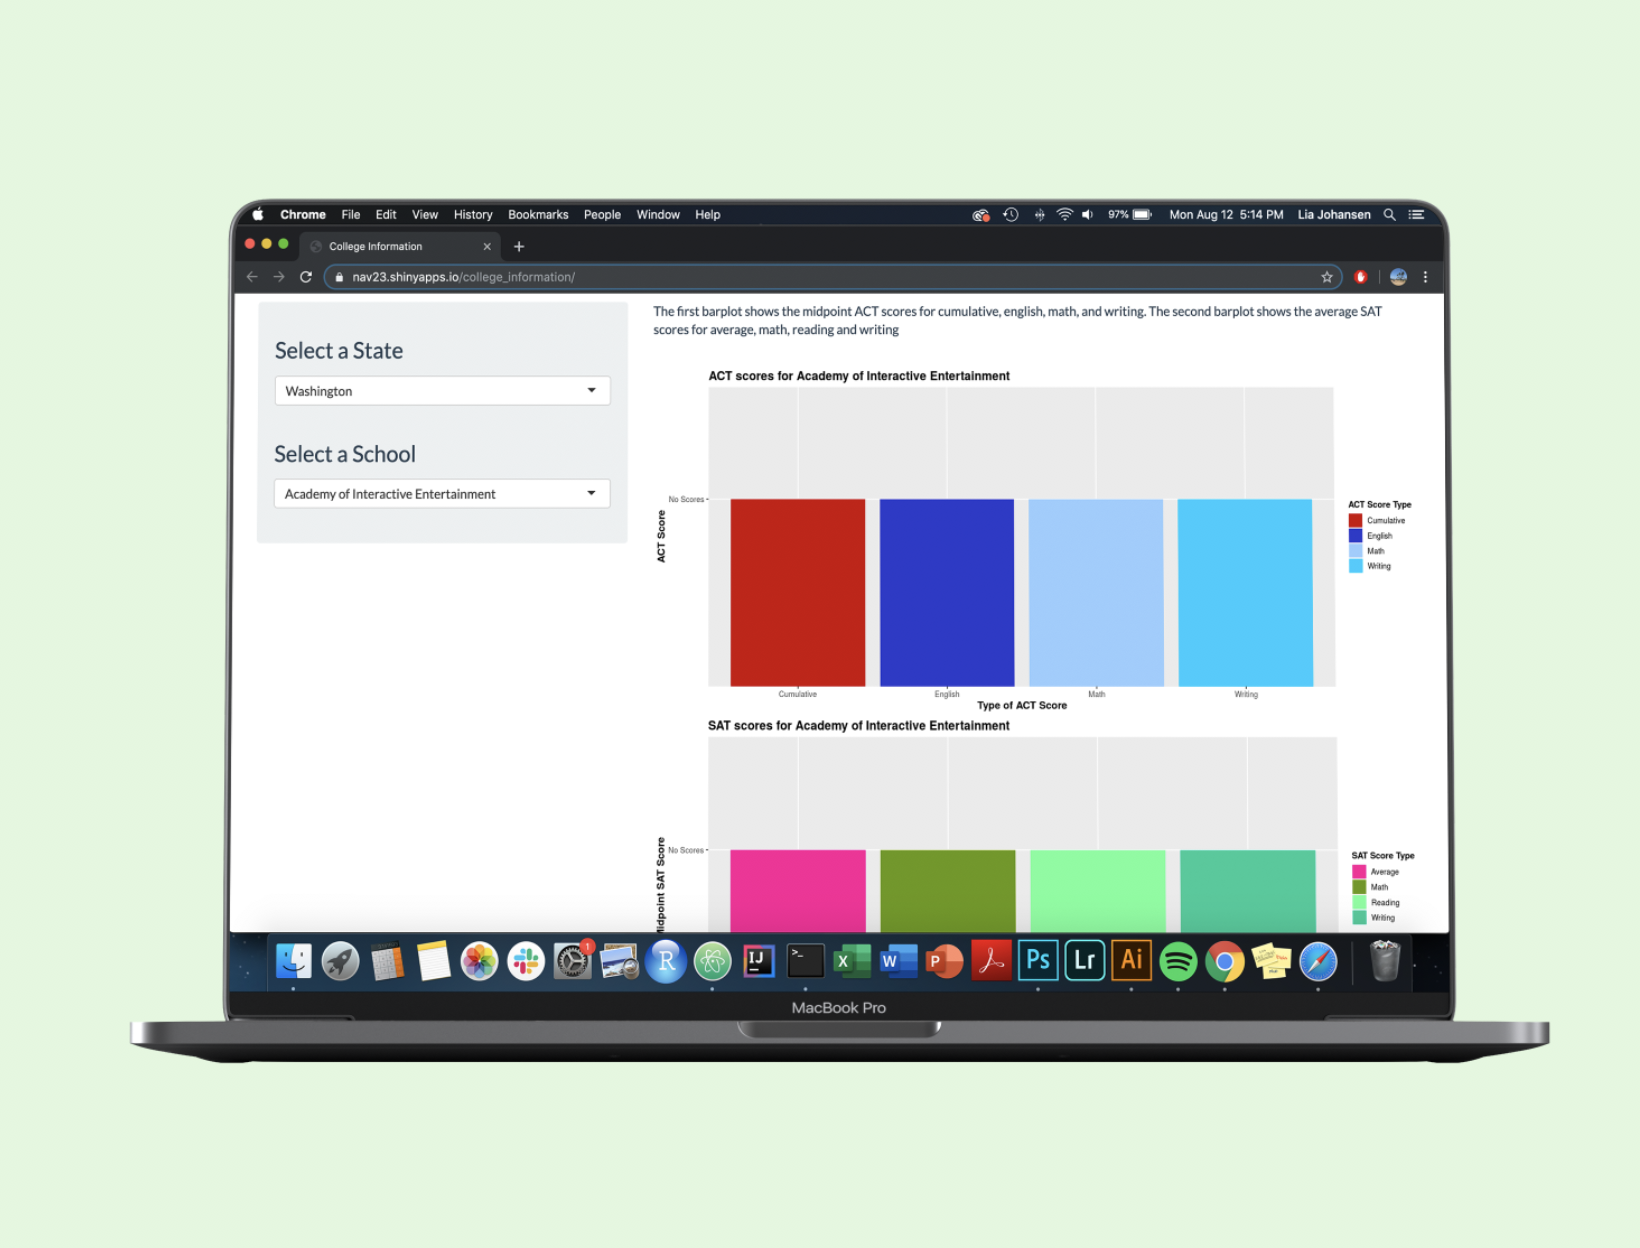
As shown in the above figures, the user is prompted to select a state and college from two drop down menus. The webpage then shows one set of bar charts for ACT scores and another for SAT scores, as some students take the ACT and others take the SAT. This allows students to compare these stats with their own scores.
SHINY APP
Our team created four interactive widgets that presented the data through easy to read visualizations.
1. Location: The locations tab allows students to locate all the available colleges within a selected state. Hovering a mouse over a marker displays the full name of the college.
2. Diversity: The diversity tab allows students to examine race data for colleges. Students choose a state and college. A pie chart generates race percentages for each school. Hovering over the pie chart slice shows exact percentages. A table also presents the data alongside the graph.
3. Score: The score tab allows students to view the ACT and SAT scores for a particular school. The user selects a state and a college from the drop down menu. A generated bar graph displays the midpoint ACT and another bar graph shows the midpoint SAT score.
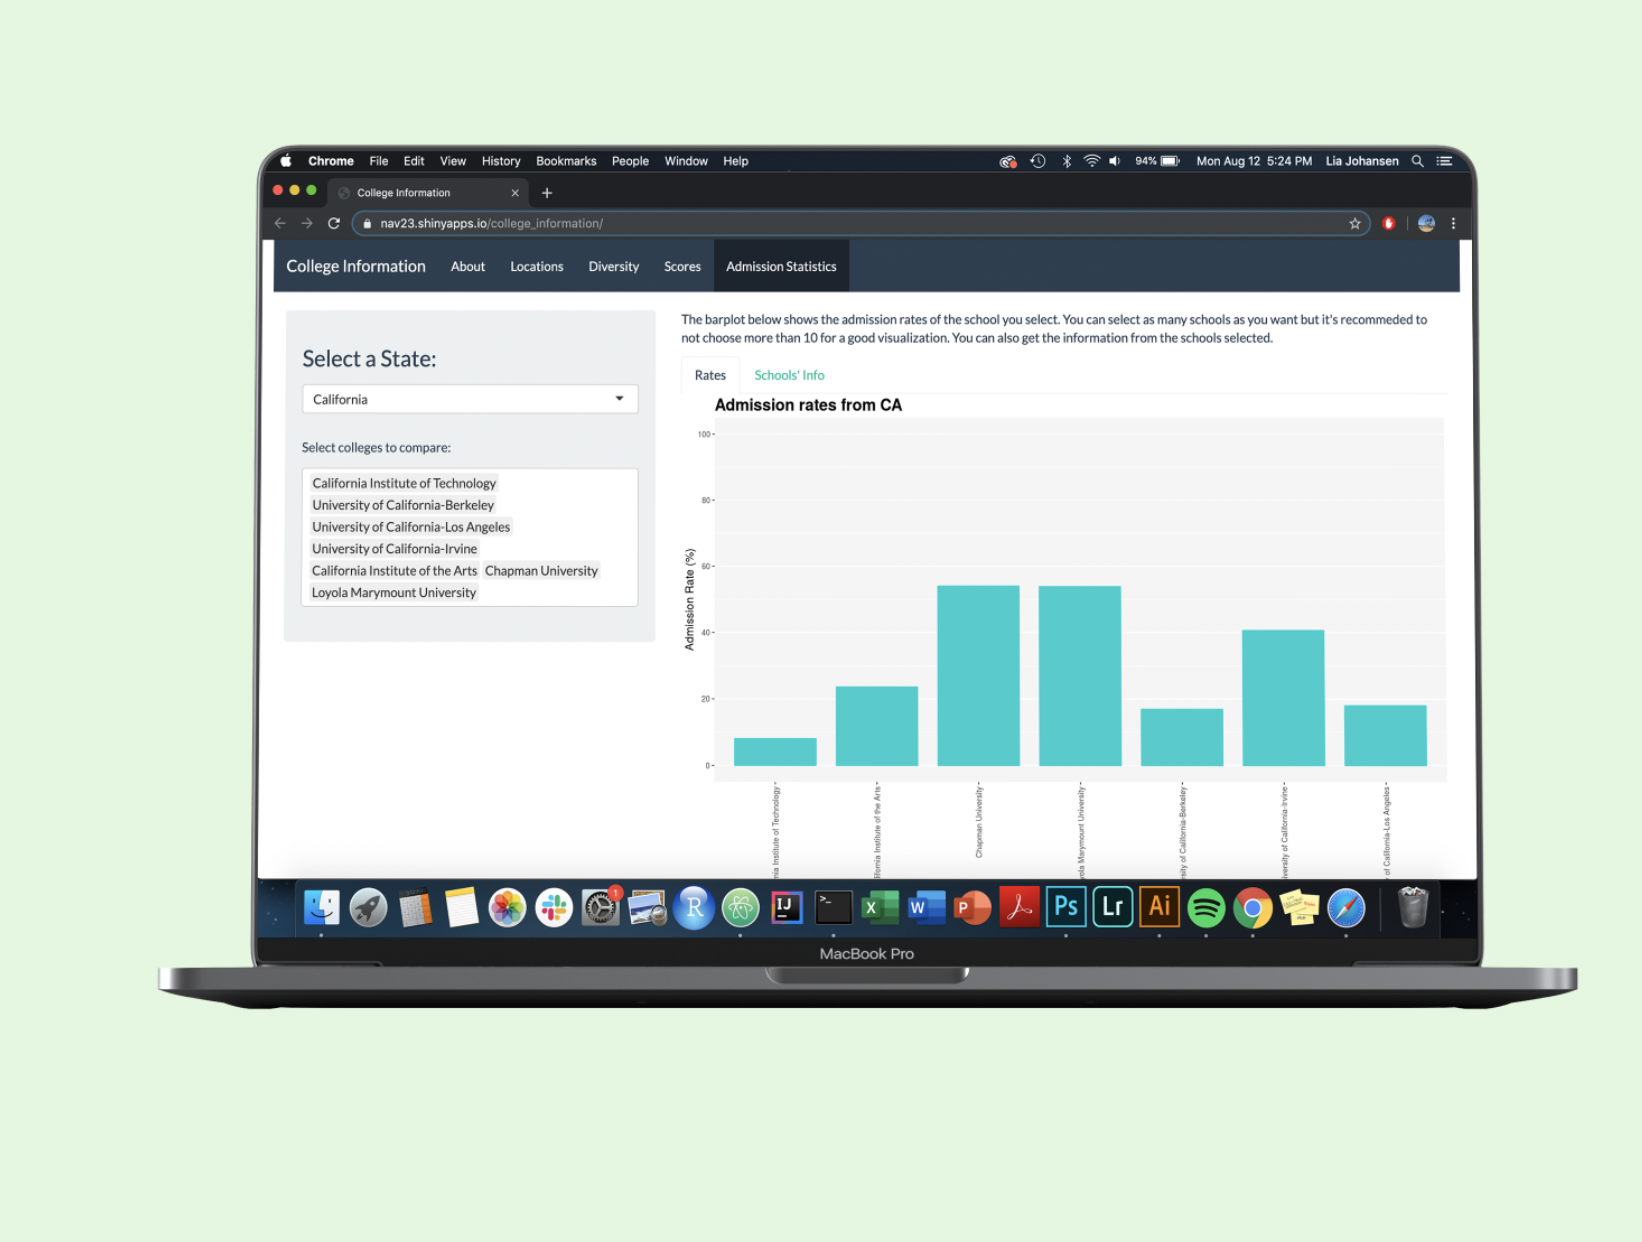
4. Admission Statistics: The admissions tab allows students to easily compare the admission rates of selected colleges. Students can view a table of information: name, city, state, in-state tuition, out of state tuition, and links to college websites.
View all of the widgets in our final project here!
TAKEAWAYS

Define responsibilities early
Before starting to code, my team sat down and agreed to the deliverables each person was responsible for completing and their respective due dates. I learned that this approach helps projects stay on track and reinforces accountability across team members.

Playing around finds bugs
I learned that it's fun and helpful to play around with your code. I found multiple bugs in my code simply by playing. Once I found one bug, I reconsidered the edge cases of my code. In the end, playing around expanded my awareness for potential bugs in future coding projects.
